| Table of Contents |
|---|
...
This block filters the history results in the table. You can choose to display only the information related to a particular user or status. If some users or statuses are selected, table results will be calculated based on the input data.
...
(For example: Selecting user John Smith and status Open would show only the time issues were assigned to John Smith while being in Open status. i.e. No other data on other users or statuses will be displayed.)
Display additional filter
...
| Note |
|---|
Calendar presets are global and can be created by Jira Administrators. |
| Info |
|---|
Time used for calculation is based on your Jira’s default time zone. |
Charts
Time statistic reports can provide information using charts. Charts represent information about time spent in issues.
They can be built based on the whole issue data or by particular Status/Assignee depending on the selected view mode.
Steps:
Go to Time Spent reports page (top of the page).
Perform your request and get report result.
Press the chart icon to open a dialog window with chart settings.
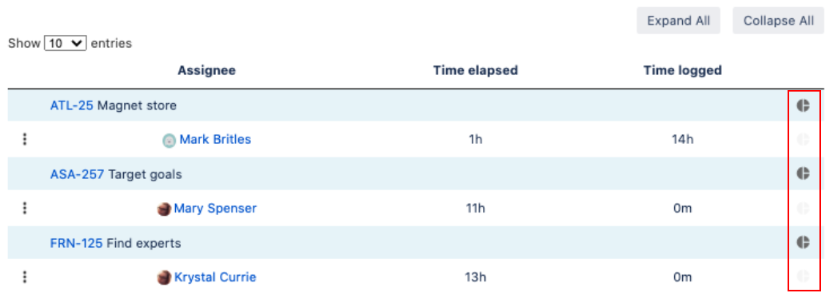
| Info |
|---|
Chart icon is located on each line visualizing its content. |
This dialog supports several types of charts:
I. Pie
...
II. Bar
...
III. Doughnut
...
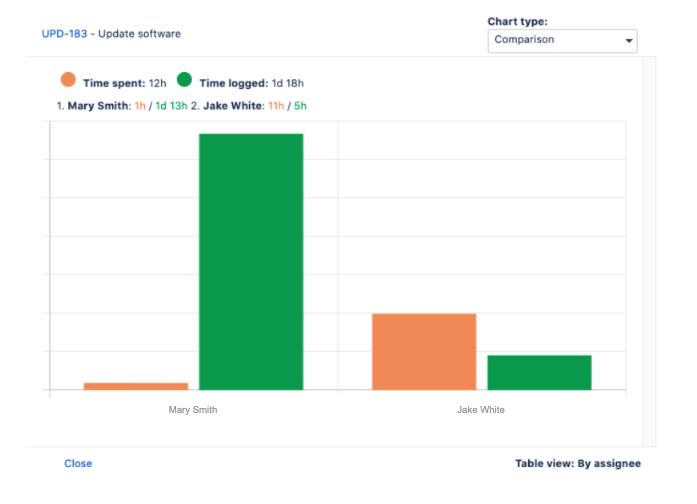
IV. Comparison
| Info |
|---|
This type of chart is available only for Table view By Assignee. It shows data both on time spent and time logged. |
Issue View
After add-on installation, every issue obtains an additional tab in the Activity section - Time Spent.
...